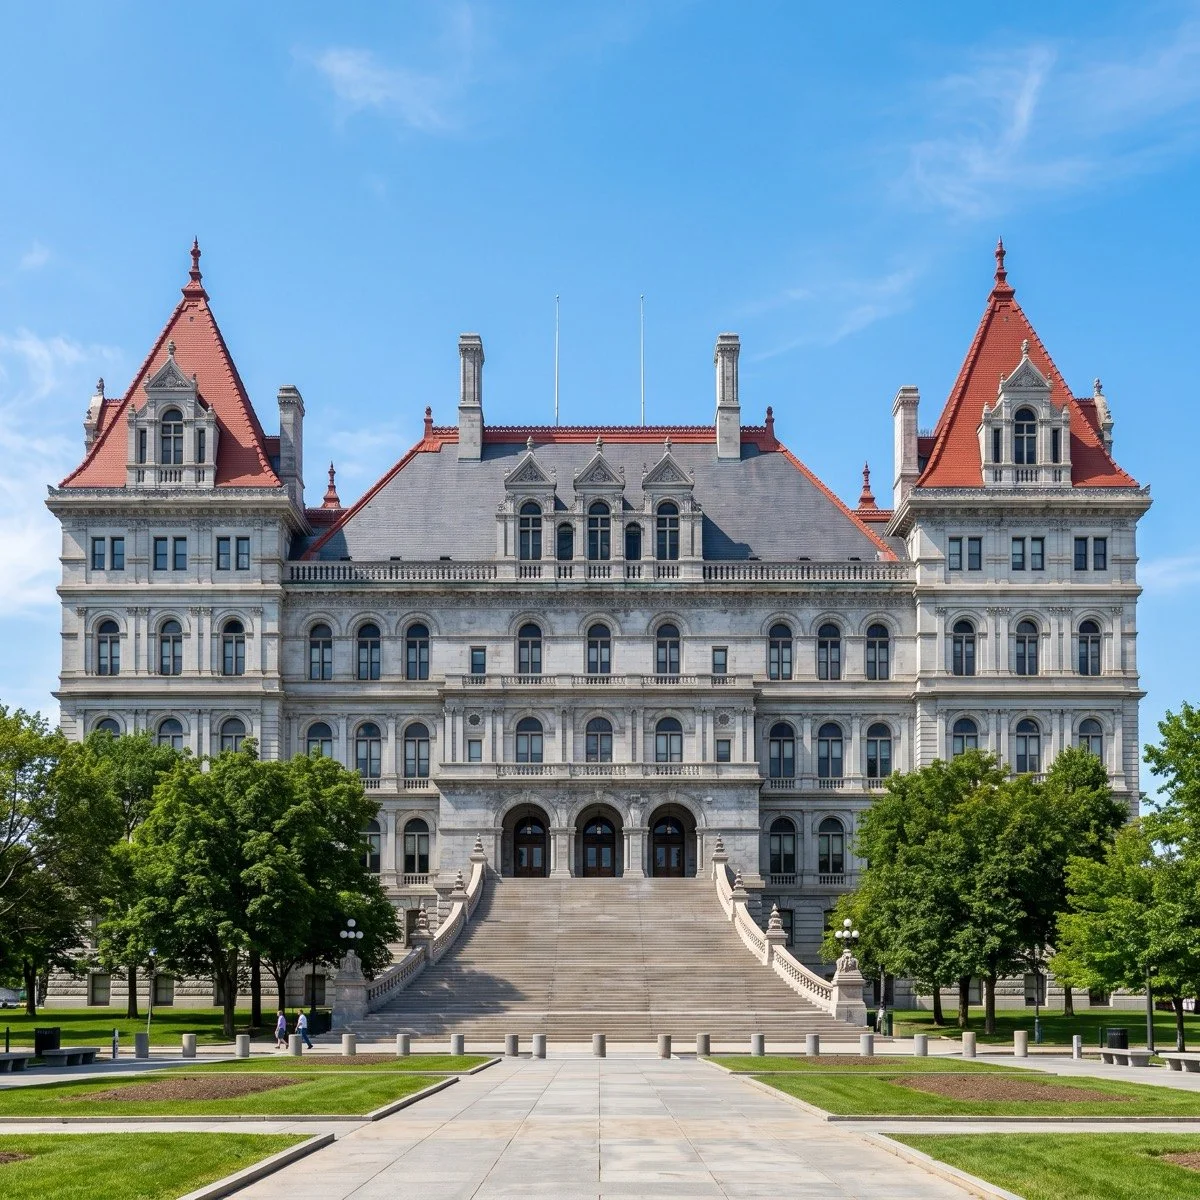
The New York State Capitol in Albany. Stock photo for RFTUV.
By Callahan Blackwood | November 5, 2026
Six days before New York voted, a Siena College poll found 49 percent of likely voters said the state was headed in the wrong direction. Fewer than three in ten expected the governor to make their lives more affordable. On Tuesday, with 12,176 of 13,187 election districts reporting unofficial results, that same governor won by nineteen points.
This is not a paradox that requires a theory of voter irrationality to explain. It requires a structural inventory.
The Polling Record, Read Carefully
The same Siena surveys that documented dissatisfaction also documented a lead. The August 12, 2026 likely-voter poll put Governor Kathy Hochul ahead of Nassau County Executive Bruce Blakeman 49 to 39, with wrong-direction sentiment already at 47 percent against 43 percent who said right track. The October 28 survey, the final major poll before the election, moved wrong-direction to 49 percent and right track to 41. The affordability number stayed stuck: only three in ten likely voters thought Hochul would make life more affordable. The lead did not dissolve.
The June 25, 2026 Siena survey asked New Yorkers to rank their concerns. Cost of living ranked first. Then cost of living. Then cost of living a third time. That is not an ambiguous signal. The gap between that signal and the ballot box does not close through psychology. It closes through structure.
Voters can hold two positions at once: a negative assessment of the state's direction and a preference for the incumbent coalition over the offered alternative. The polling record shows those positions coexisting.
What the Record Shows on Cost
The costs pressing New York households are documented and specific. The state Department of Public Service approved a Con Edison rate plan on January 22, 2026, that added $6.81 per month, a 4.9 percent increase in delivery charges for a residential customer using 600 kilowatt-hours per month in year one, with a $6.57 increase in year two and $6.61 in year three. That covers Con Edison territory, the downstate region. It does not cover every corner of the state.
The state's 2026 summer energy outlook projected that statewide typical residential electricity supply bills for 600 kilowatt-hours would average $58.62 per month, roughly 1.5 percent above the prior summer. Full bills add regulated delivery charges on top of that figure.
The Census Bureau's QuickFacts placed New York's estimated 2025 population at 20,002,427, about one percent below the April 2020 base, with a poverty rate of 13.8 percent. A separate Census analysis released in May 2026 found the New York-Newark-Jersey City metropolitan area posted a net domestic outmigration of approximately 1.3 million residents between 2020 and 2025. International immigration offset those losses at the metro level. The state-level picture is a combination of both flows, and neither the collapse nor the recovery framing fits cleanly.
The Federal Trade Commission's 2024 Consumer Sentinel data for New York logged 278,662 fraud and other consumer-harm reports, $534 million in total reported fraud losses at a median loss of $429, and 58,692 identity-theft reports. The FTC notes these are reported incidents, not a complete count of harm. They document real pressure on households. The record supplied here cannot attribute causation to specific state decisions or quantify what intervention would have changed them.
The data confirms, collectively, that cost pressure in New York was real, documented, and named by voters as their first concern for months before Election Day. The record does not establish that the Hochul administration caused these conditions or that the Blakeman-Hood platform would have reversed them. That is a claim neither side has established in the material available to this article.
The Machine That Decides Before November
The more precise question is why dissatisfied voters so rarely encountered a meaningful contest before the general election reached them.
New York uses closed primaries. Under the structure documented in the New York City Campaign Finance Board's 2024 voter-analysis report, voters who are not enrolled in a major party cannot participate in party nominations. The state Board of Elections publishes enrollment statistics by election district, confirming that a substantial share of registered New Yorkers, those enrolled as unaffiliated or in minor parties, hold no vote in the process that determines who appears on the general-election ballot in most districts. The nomination, in many cases, settles the race.
Turnout figures for local elections give scale to that bottleneck. The NYC Campaign Finance Board's 2023 voter-analysis report found citywide primary turnout of 7.2 percent and general-election turnout of 12.8 percent in an off-year with few competitive council races. In ranked-choice races, 87.5 percent were decided in the first round, meaning the broader-coalition mechanism built into ranked-choice voting rarely came into play. The CFB recommended moving city elections to even years to improve participation. That recommendation has not yet been adopted. These are New York City figures; the statewide primary-turnout pattern cannot be precisely stated from the records supplied here.
The nomination calendar compounds the effect. The state Board of Elections' 2026 political calendar fixed the June 23 primary date. A candidate who prevails in a low-turnout June primary in a district with heavy enrollment skew in one direction has effectively won the seat months before November. The general election, in that district, ratifies a decision the primary electorate already made, a primary electorate that, by design, excludes independent and third-party voters.
Uncontested and Underfunded: The Local Version of the Problem
Consider Dutchess County on Tuesday. Eight of the county's 25 legislative districts had no opponent on the ballot. Voters in those eight districts received no choice. This is a routine feature of American local elections, practiced by both parties across the country. It is also the most direct way a democratic mechanism fails to register voter unhappiness: if your representative runs without opposition, there is no mechanism for dissatisfaction to produce a different result.
The state Board of Elections' 136-page amended certification for the November 3, 2026 general election lists candidates by office and district. Some state legislative districts show no major-party candidate on one or more lines. The pack supplied to this article does not include a counted total of statewide uncontested seats, and this article will not invent one. The certification confirms that the phenomenon extends beyond Dutchess County.
Money shapes the candidate pool before any voter weighs in. The state Board of Elections' public reporting system tracks contributions and expenditures by office and district, making campaign resources visible and comparable. The records supplied here do not establish a spending threshold or prove how money changed any particular race, so this article will not invent one.
District lines, redrawn after the 2020 Census and effective since January 2023, shape the electorates that candidates must win. Maps determine which voters a candidate courts and which coalitions are achievable. The supplied record does not establish unlawful intent in any specific map, and this article does not allege it.
Why the Alternative Did Not Close the Distance
The Republican ticket was present. Bruce Blakeman and his running mate drew 2,340,313 votes, 39.66 percent of the unofficial count. Those are real voters, and they did not appear despite the structural dynamics described above, they appeared within them. The alternative was available. It did not prevail.
The Siena polls supply the most useful account of why the gap held. In August, with wrong-direction sentiment already elevated, Hochul led Blakeman 49 to 39. In late October, with affordability trust at three in ten, that lead had not dissolved. The voters who answered both questions, who told pollsters the state was going the wrong way and who still preferred the incumbent coalition, made a comparison between two specific options and reached a conclusion. This article will not speculate about the reasoning. The polling record does not show voters found Blakeman dishonest or unqualified. It shows they preferred Hochul when the final choice arrived.
A general-election result settles who governs. It does not establish that the winning coalition earned endorsement on every issue it will now decide, and it does not resolve the underlying dissatisfaction that the same polls measured throughout the year.
What the Governing Record Shows, and Does Not Prove
New York City's FY2025 Mayor's Management Report credited 72.7 percent of city streets as rated good, above the 71 percent target, with 180,570 potholes repaired, an increase of 17 percent over the prior year. That is a city-agency metric. It does not describe statewide road conditions; the state Department of Transportation's 2024 pavement-condition report covers that territory and should be read directly.
The state Division of Criminal Justice Services' criminal-justice footprint shows index crime in New York City and non-NYC regions decreased slightly in 2024 after recent increases. New York City's 2024 crime level remained 37 percent above its 2015 level. That gap is documented and significant. This article will not convert it into a statewide claim or attach it to a governance verdict the record does not support.
The state Unified Court System's 2025 annual report records 31,524 filings and 34,227 dispositions in superior criminal courts, including 29,090 guilty pleas, 831 convictions after trial, 167 acquittals, 2,493 dismissals, and 1,479 other dispositions. The court processed more cases than it received. The numbers show throughput. They do not measure how long cases waited before resolution, or whether litigants trusted the process. Those are different claims requiring different data.
The Gap That Goes to Albany With the Winner
Fifty-nine percent is not an instruction to ignore the other 49 percent, the ones who told Siena the state was headed in the wrong direction. That figure grew four points between August and October. Fewer than a third of likely voters expected the governor to make their lives more affordable. Those numbers travel to Albany with the winning margin. They do not evaporate because they did not tip the race.
The structural conditions are public and traceable: closed primaries, low-turnout nomination contests, uncontested seats, disclosed campaign finances, and post-census district lines. They do not erase voter choice, but they shape when and where that choice is meaningful.
Tuesday settled who governs New York for the next term. It did not settle whether the governing coalition will make life cheaper, safer, or more stable for the voters who said, repeatedly and by increasing margins through 2026, that they did not think it was moving in the right direction. That question does not appear on the ballot again until 2028.
Sources
- New York State Board of Elections - Unofficial Election Night Reporting
- Siena College Research Institute - Likely New York State Voter Poll, August 12, 2026
- Siena College Research Institute - Likely New York State Voter Poll, October 28, 2026
- Siena College Research Institute - SNY June 2026 Poll Release, June 25, 2026
- U.S. Census Bureau - QuickFacts: New York State
- U.S. Census Bureau - Major City and Outer Edge Growth, May 2026
- New York Department of Public Service - Con Edison Electric Rate Case Summary, January 22, 2026
- New York Department of Public Service - Summer Energy Outlook 2026
- Federal Trade Commission - Consumer Sentinel Network Data Book 2024
- Federal Trade Commission - FTC Testifies Before Joint Economic Committee on Efforts to Combat Fraud, March 2026
- New York State DOT - Pavement Management Division
- New York State DOT - 2024 Pavement Condition Report (Draft)
- New York City Mayor's Management Report FY2025
- New York State DCJS - Criminal Justice Footprint
- New York State Unified Court System - 2025 Annual Report
- New York State Board of Elections - Certification of November 3, 2026 General Election
- New York State Board of Elections - 2026 Political Calendar
- New York State Board of Elections - Enrollment by Election District
- New York City Campaign Finance Board - 2023 Voter Analysis Report
- New York City Campaign Finance Board - 2024 Voter Analysis Report
- New York State Board of Elections - Public Reporting System
- New York State Board of Elections - New York State Elected Officials